Data Desk · United States
Government outgrew private employers in 16 of 50 states over the past year
By The Liberty Tribune Data Desk ·
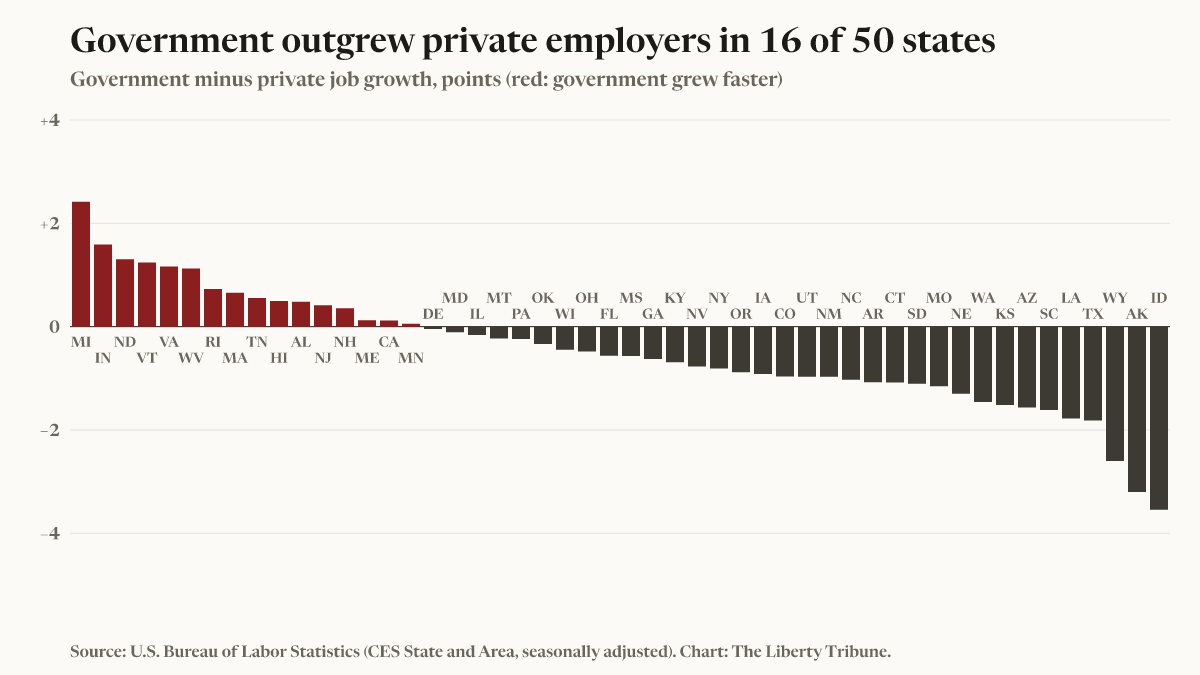
Government payrolls grew faster than private-sector employment in 16 of 50 states over the 12 months to October 2026, according to a Liberty Tribune analysis of U.S. Bureau of Labor Statistics data.
Nationwide, government employment shrank 0.2% to 23.33 million jobs, while private employment grew 0.7%. Government payrolls shrank in 15 states and grew in 32.
Government outpaced private employers by the widest margins in Michigan (2.4 points), Indiana (1.6 points) and North Dakota (1.3 points). Private employers ran furthest ahead of government in Idaho (3.5 points), Alaska (3.2 points) and Wyoming (2.6 points).
Government's share of all jobs ranges from 11.3% in Pennsylvania to 24.0% in Wyoming. The figures cover federal, state and local government, including public schools and universities.
The table below lists every state: government jobs, government's share of all jobs, and the 12-month change in government and private employment.
| State | Government jobs | Share of all jobs | Government change | Private change | Gap (points) |
|---|---|---|---|---|---|
| Michigan | 644,000 | 14.3% | +2.4% | 0.0% | +2.4 |
| Indiana | 433,000 | 13.2% | +2.5% | +0.9% | +1.6 |
| North Dakota | 86,400 | 19.3% | +1.5% | +0.2% | +1.3 |
| Vermont | 56,600 | 18.2% | +0.9% | −0.4% | +1.2 |
| Virginia | 760,700 | 17.9% | +0.7% | −0.4% | +1.2 |
| West Virginia | 147,100 | 20.6% | +0.5% | −0.6% | +1.1 |
| Rhode Island | 65,100 | 12.7% | +0.8% | 0.0% | +0.7 |
| Massachusetts | 476,900 | 12.8% | +1.0% | +0.3% | +0.7 |
| Tennessee | 461,300 | 13.6% | +1.5% | +0.9% | +0.6 |
| Hawaii | 125,100 | 19.5% | +0.4% | −0.1% | +0.5 |
| Alabama | 432,600 | 19.5% | +1.6% | +1.2% | +0.5 |
| New Jersey | 623,700 | 14.2% | +0.5% | +0.1% | +0.4 |
| New Hampshire | 86,800 | 12.4% | +0.8% | +0.5% | +0.4 |
| Maine | 102,200 | 15.5% | +0.6% | +0.5% | +0.1 |
| California | 2,681,900 | 14.7% | +1.1% | +1.0% | +0.1 |
| Minnesota | 441,900 | 14.4% | +1.3% | +1.2% | +0.1 |
| Delaware | 72,300 | 14.5% | +1.0% | +1.0% | 0.0 |
| Maryland | 528,000 | 18.9% | +0.4% | +0.5% | −0.1 |
| Illinois | 856,300 | 13.9% | +0.4% | +0.6% | −0.2 |
| Montana | 91,000 | 17.4% | −0.9% | −0.6% | −0.2 |
| Pennsylvania | 703,700 | 11.3% | +0.5% | +0.8% | −0.2 |
| Oklahoma | 372,700 | 20.7% | +0.6% | +1.0% | −0.3 |
| Wisconsin | 411,300 | 13.5% | +0.5% | +1.0% | −0.4 |
| Ohio | 796,800 | 14.0% | +0.4% | +0.8% | −0.5 |
| Florida | 1,144,100 | 11.4% | +0.5% | +1.1% | −0.6 |
| Mississippi | 237,100 | 19.8% | 0.0% | +0.6% | −0.6 |
| Georgia | 708,500 | 14.2% | −0.2% | +0.5% | −0.6 |
| Kentucky | 314,900 | 15.5% | −0.2% | +0.5% | −0.7 |
| Nevada | 185,700 | 11.4% | +0.9% | +1.6% | −0.8 |
| New York | 1,510,800 | 15.2% | −0.7% | +0.2% | −0.8 |
| Oregon | 314,000 | 15.9% | −0.6% | +0.2% | −0.9 |
| Iowa | 267,800 | 16.8% | 0.0% | +0.9% | −0.9 |
| Colorado | 484,600 | 16.3% | −0.5% | +0.5% | −1.0 |
| Utah | 277,100 | 15.4% | +0.9% | +1.9% | −1.0 |
| New Mexico | 191,400 | 21.2% | +0.5% | +1.4% | −1.0 |
| North Carolina | 780,600 | 15.2% | +0.8% | +1.8% | −1.0 |
| Arkansas | 204,600 | 15.1% | +0.1% | +1.2% | −1.1 |
| Connecticut | 235,400 | 13.6% | 0.0% | +1.1% | −1.1 |
| South Dakota | 80,600 | 17.2% | −1.1% | 0.0% | −1.1 |
| Missouri | 432,800 | 14.4% | +0.1% | +1.3% | −1.2 |
| Nebraska | 177,500 | 16.7% | −0.6% | +0.7% | −1.3 |
| Washington | 608,000 | 16.6% | −0.7% | +0.8% | −1.5 |
| Kansas | 259,000 | 17.5% | −0.2% | +1.3% | −1.5 |
| Arizona | 425,400 | 13.0% | −0.4% | +1.2% | −1.6 |
| South Carolina | 399,500 | 16.4% | +0.5% | +2.1% | −1.6 |
| Louisiana | 326,400 | 16.1% | +0.5% | +2.3% | −1.8 |
| Texas | 2,129,700 | 14.7% | −0.1% | +1.7% | −1.8 |
| Wyoming | 71,200 | 24.0% | −1.0% | +1.6% | −2.6 |
| Alaska | 77,200 | 22.6% | −1.2% | +2.0% | −3.2 |
| Idaho | 127,800 | 14.4% | −1.8% | +1.8% | −3.5 |
Source: U.S. Bureau of Labor Statistics, Current Employment Statistics (State and Area), seasonally adjusted, government SMS{state}000009000000001, private SMS{state}000000500000001, all jobs SMS{state}000000000000001; CES9000000001, CES0500000001 and CES0000000001 for the nation. Changes compare the same month a year earlier. Government covers federal, state and local government, including public education. State figures are preliminary and revised by BLS. Ranks exclude the District of Columbia. Computed by The Liberty Tribune from the published series.
Data retrieved from the BLS public API on November 20, 2026. BLS.gov cannot vouch for the data or analyses derived from these data after the data have been retrieved from BLS.gov.
Free to cite or republish with attribution and a link. The chart is ours and may be reused on the same terms.
Republish this story, free
Newsrooms and newsletters may run this story and its chart at no cost. The credit line and the link back are already written in. Edit for length, keep the facts. Full terms.
More from October 2026
- Michigan government payrolls grew 2.4% in a year, outpacing private employers by the widest margin of any state
- Indiana government payrolls grew 2.5% in a year, outpacing private employers by the second-widest margin of any state
- North Dakota government payrolls grew 1.5% in a year, outpacing private employers by the third-widest margin of any state
- California adds 47,100 jobs in October, the most of any state
- Texas adds 30,600 jobs in October, the second-most of any state
- Indiana adds 15,900 jobs in October, the third-most of any state
- New York loses 6,600 jobs in October, the largest loss of any state
- Colorado loses 5,700 jobs in October, the second-largest loss of any state