Data Desk · United States
Paychecks trailed prices in 38 of 50 states over the past year
By The Liberty Tribune Data Desk ·
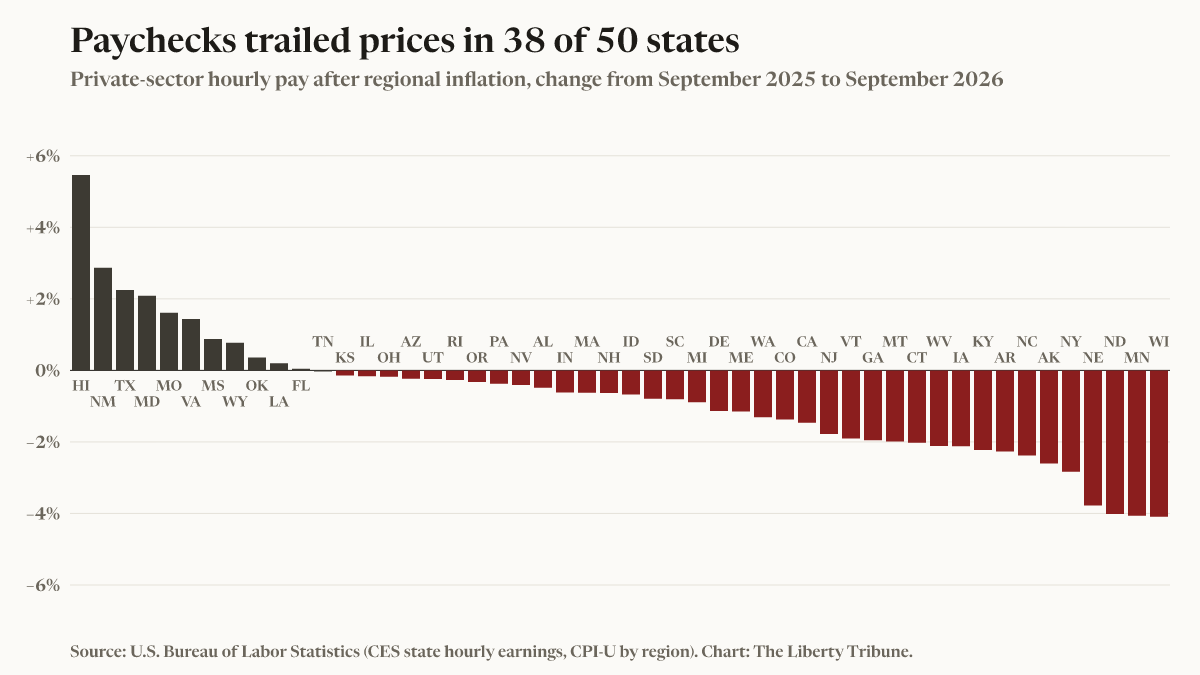
A caution on this measure: state pay figures swing widely from month to month. Measured the same way, pay trailed prices in 18 states in August and 29 in July. Comparing average pay over the latest 11 months with data against the same months a year earlier, it trailed in 24 of 50 states. October 2025 is left out because BLS has no price figure for it.
Average hourly earnings for private-sector workers rose more slowly than consumer prices in 38 of 50 states over the 12 months to September 2026, according to a Liberty Tribune analysis of U.S. Bureau of Labor Statistics data.
Nationwide, average hourly earnings rose 2.9% to $37.69 while prices rose 3.7%, so an hour of work buys 0.8% less than it did a year earlier.
Regional prices rose 4.2% in the Midwest, 4.2% in the Northeast, 3.4% in the West and 3.4% in the South. Pay fell behind in 11 of 12 Midwest states, all 9 Northeast states, 10 of 13 West states and 8 of 16 South states.
The widest gaps between pay and prices were in Wisconsin (4.1%), Minnesota (4.1%) and North Dakota (4.0%). Pay ran furthest ahead of prices in Hawaii (5.5%), New Mexico (2.9%) and Texas (2.3%).
The table below lists every state: hourly pay now and a year earlier, its change, the change in prices in its region, and what that leaves after inflation.
| State | Hourly pay | Year earlier | Pay change | Prices (region) | After inflation |
|---|---|---|---|---|---|
| Hawaii | $41.08 | $37.66 | +9.1% | +3.4% West | +5.5% |
| New Mexico | $31.43 | $29.54 | +6.4% | +3.4% West | +2.9% |
| Texas | $36.76 | $34.76 | +5.8% | +3.4% South | +2.3% |
| Maryland | $38.19 | $36.17 | +5.6% | +3.4% South | +2.1% |
| Missouri | $34.38 | $32.46 | +5.9% | +4.2% Midwest | +1.6% |
| Virginia | $38.63 | $36.82 | +4.9% | +3.4% South | +1.4% |
| Mississippi | $29.36 | $28.14 | +4.3% | +3.4% South | +0.9% |
| Wyoming | $33.53 | $32.17 | +4.2% | +3.4% West | +0.8% |
| Oklahoma | $32.21 | $31.03 | +3.8% | +3.4% South | +0.4% |
| Louisiana | $31.11 | $30.02 | +3.6% | +3.4% South | +0.2% |
| Florida | $36.02 | $34.81 | +3.5% | +3.4% South | 0.0% |
| Tennessee | $32.26 | $31.20 | +3.4% | +3.4% South | 0.0% |
| Kansas | $33.06 | $31.76 | +4.1% | +4.2% Midwest | -0.1% |
| Illinois | $36.83 | $35.39 | +4.1% | +4.2% Midwest | -0.2% |
| Ohio | $34.39 | $33.05 | +4.1% | +4.2% Midwest | -0.2% |
| Arizona | $36.29 | $35.17 | +3.2% | +3.4% West | -0.2% |
| Utah | $36.02 | $34.91 | +3.2% | +3.4% West | -0.2% |
| Rhode Island | $37.94 | $36.50 | +3.9% | +4.2% Northeast | -0.3% |
| Oregon | $38.63 | $37.47 | +3.1% | +3.4% West | -0.3% |
| Pennsylvania | $34.11 | $32.85 | +3.8% | +4.2% Northeast | -0.4% |
| Nevada | $33.26 | $32.29 | +3.0% | +3.4% West | -0.4% |
| Alabama | $32.35 | $31.43 | +2.9% | +3.4% South | -0.5% |
| Indiana | $33.70 | $32.53 | +3.6% | +4.2% Midwest | -0.6% |
| Massachusetts | $43.75 | $42.24 | +3.6% | +4.2% Northeast | -0.6% |
| New Hampshire | $36.92 | $35.65 | +3.6% | +4.2% Northeast | -0.6% |
| Idaho | $35.74 | $34.79 | +2.7% | +3.4% West | -0.7% |
| South Dakota | $32.44 | $31.37 | +3.4% | +4.2% Midwest | -0.8% |
| South Carolina | $33.62 | $32.77 | +2.6% | +3.4% South | -0.8% |
| Michigan | $34.62 | $33.51 | +3.3% | +4.2% Midwest | -0.9% |
| Delaware | $34.10 | $33.35 | +2.2% | +3.4% South | -1.1% |
| Maine | $33.68 | $32.69 | +3.0% | +4.2% Northeast | -1.1% |
| Washington | $43.80 | $42.91 | +2.1% | +3.4% West | -1.3% |
| Colorado | $40.19 | $39.40 | +2.0% | +3.4% West | -1.4% |
| California | $42.58 | $41.78 | +1.9% | +3.4% West | -1.5% |
| New Jersey | $39.32 | $38.41 | +2.4% | +4.2% Northeast | -1.8% |
| Vermont | $36.00 | $35.21 | +2.2% | +4.2% Northeast | -1.9% |
| Georgia | $35.39 | $34.90 | +1.4% | +3.4% South | -2.0% |
| Montana | $33.28 | $32.83 | +1.4% | +3.4% West | -2.0% |
| Connecticut | $40.06 | $39.23 | +2.1% | +4.2% Northeast | -2.0% |
| West Virginia | $30.12 | $29.75 | +1.2% | +3.4% South | -2.1% |
| Iowa | $31.23 | $30.61 | +2.0% | +4.2% Midwest | -2.1% |
| Kentucky | $30.63 | $30.29 | +1.1% | +3.4% South | -2.2% |
| Arkansas | $29.85 | $29.53 | +1.1% | +3.4% South | -2.3% |
| North Carolina | $34.48 | $34.15 | +1.0% | +3.4% South | -2.4% |
| Alaska | $38.43 | $38.15 | +0.7% | +3.4% West | -2.6% |
| New York | $39.87 | $39.37 | +1.3% | +4.2% Northeast | -2.8% |
| Nebraska | $32.89 | $32.79 | +0.3% | +4.2% Midwest | -3.8% |
| North Dakota | $35.45 | $35.43 | +0.1% | +4.2% Midwest | -4.0% |
| Minnesota | $39.78 | $39.78 | 0.0% | +4.2% Midwest | -4.1% |
| Wisconsin | $34.46 | $34.47 | 0.0% | +4.2% Midwest | -4.1% |
Source: U.S. Bureau of Labor Statistics. Pay: Current Employment Statistics (State and Area), average hourly earnings of all employees, total private, not seasonally adjusted, series SMU{state}000000500000003; CEU0500000003 for the nation. Prices: Consumer Price Index for All Urban Consumers, all items, not seasonally adjusted, regional series CUUR0100SA0, CUUR0200SA0, CUUR0300SA0, CUUR0400SA0; CUUR0000SA0 for the nation. Both compared with the same month a year earlier; pay after inflation is (1 + pay growth) / (1 + price growth) - 1. BLS publishes no statewide price index, so each state is measured against its Census region. State figures are preliminary. The District of Columbia is excluded. Computed by The Liberty Tribune from the published series.
Data retrieved from the BLS public API on October 30, 2026. BLS.gov cannot vouch for the data or analyses derived from these data after the data have been retrieved from BLS.gov.
Free to cite or republish with attribution and a link. The chart is ours and may be reused on the same terms.
Republish this story, free
Newsrooms and newsletters may run this story and its chart at no cost. The credit line and the link back are already written in. Edit for length, keep the facts. Full terms.
More from September 2026
- Wisconsin paychecks fell 4.1% behind prices over the past year, the widest gap of any state
- Minnesota paychecks fell 4.1% behind prices over the past year, the second-widest gap of any state
- North Dakota paychecks fell 4.0% behind prices over the past year, the third-widest gap of any state
- Hawaii paychecks beat prices by 5.5% over the past year, the most of any state
- New Mexico paychecks beat prices by 2.9% over the past year, the second-most of any state
- Texas paychecks beat prices by 2.3% over the past year, the third-most of any state
- Government payrolls shrank in 33 of 50 states over the past year
- Michigan government payrolls grew 2.4% in a year, outpacing private employers by the widest margin of any state