Pennsylvania Democrats' registration lead grew in 2026 after seven years of shrinking
By The Liberty Tribune Data Desk ·
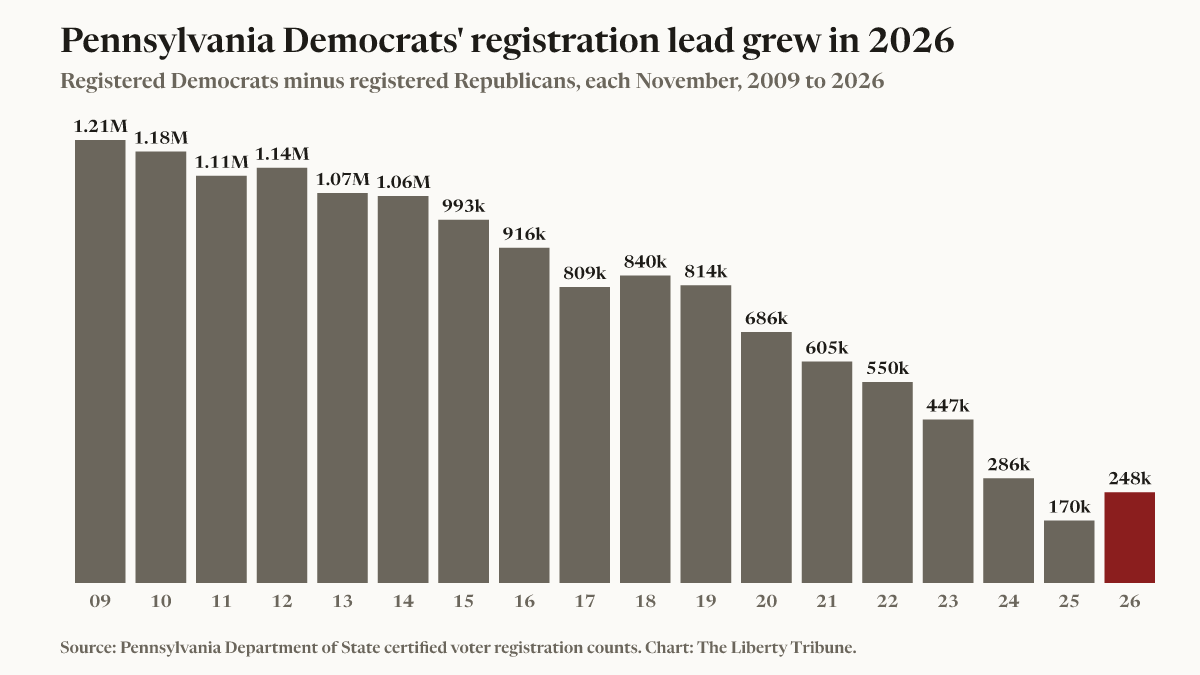
Democrats' lead over Republicans in Pennsylvania voter registration grew by 77,576 over the past year, to 248,061, according to the certified county counts the Department of State published for the November 3, 2026 general election. It is the first time since 2018 that the lead has grown from one November to the next.
The gain ends seven straight years of decline. The lead was 840,443 in November 2018, 685,818 in November 2020 and 286,283 in November 2024. It reached 170,485 at the November 2025 municipal election, the smallest in any November count since at least 2009, the first year we read. Even after this year's gain, the lead is 64% smaller than in 2020.
Most of the gain came from Philadelphia and its suburbs. Philadelphia added 19,335 registered Democrats over the year while its Republican count fell by 76. Philadelphia, Bucks, Chester, Delaware and Montgomery counties together account for 41,958 of the 77,576. The Democratic lead grew in 41 of the 67 counties and shrank in 26. The three that moved furthest toward Republicans were Fayette, by 578, Greene, by 457 and Washington, by 362.
Republicans still outnumber Democrats in 55 of the 67 counties, up from 50 in November 2020 and 43 in November 2016. Five counties that had more Democrats in 2020 now have more Republicans: Beaver, Berks, Bucks, Fayette and Luzerne. Centre County went the other way this year. Republicans led there in November 2025, and Democrats lead again now.
Party switching was close to even. From January through November 2, 23,747 Republicans changed their registration to Democratic and 21,775 Democrats changed to Republican, according to the department's weekly party change report. Voters leaving a smaller party or no party moved more often to the Democrats, 41,857 against 16,700.
A caution on what these numbers measure. Registration is not turnout or votes. The county totals change as people register, move, die or are removed from the rolls under federal and state list maintenance rules, and the certified counts do not separate those causes. Total registration in the state fell by 268,251 between November 2024 and November 2025, then rose by 145,813 by this November. The 2025 count was taken at a municipal election and the 2026 count at a general election.
| County | Nov. 2020 | Nov. 2025 | Nov. 2026 | Change this year |
|---|---|---|---|---|
| Philadelphia | 726,383 | 637,023 | 656,434 | +19,411 |
| Allegheny | 271,763 | 236,396 | 245,530 | +9,134 |
| Montgomery | 89,935 | 93,229 | 100,697 | +7,468 |
| Delaware | 47,256 | 56,308 | 62,710 | +6,402 |
| Chester | 1,997 | 6,361 | 11,243 | +4,882 |
| Lehigh | 33,740 | 19,818 | 23,996 | +4,178 |
| Bucks | 10,258 | -10,216 | -6,421 | +3,795 |
| Lancaster | -66,001 | -73,112 | -69,427 | +3,685 |
| Dauphin | 12,581 | 7,928 | 11,605 | +3,677 |
| Luzerne | 19,992 | -6,979 | -4,090 | +2,889 |
| Cumberland | -28,556 | -28,221 | -25,635 | +2,586 |
| York | -58,362 | -73,295 | -70,921 | +2,374 |
| Northampton | 21,081 | 8,288 | 10,568 | +2,280 |
| Lackawanna | 38,897 | 24,031 | 25,243 | +1,212 |
| Berks | 7,970 | -14,171 | -13,066 | +1,105 |
| Centre | 2,290 | -698 | 371 | +1,069 |
| Monroe | 14,116 | 5,032 | 5,770 | +738 |
| Lebanon | -23,292 | -27,632 | -26,989 | +643 |
| Franklin | -36,334 | -41,202 | -40,600 | +602 |
| Blair | -26,444 | -31,198 | -30,719 | +479 |
| Lycoming | -21,875 | -25,855 | -25,382 | +473 |
| Butler | -35,987 | -43,935 | -43,471 | +464 |
| Erie | 24,349 | 5,596 | 6,030 | +434 |
| Union | -6,144 | -6,672 | -6,419 | +253 |
| Susquehanna | -9,085 | -11,265 | -11,122 | +143 |
| Perry | -13,083 | -15,053 | -14,911 | +142 |
| Snyder | -10,012 | -11,156 | -11,014 | +142 |
| Wyoming | -5,508 | -6,674 | -6,541 | +133 |
| Northumberland | -11,301 | -16,687 | -16,559 | +128 |
| Adams | -20,718 | -24,836 | -24,745 | +91 |
| Clinton | -4,295 | -7,223 | -7,151 | +72 |
| Clarion | -7,968 | -10,498 | -10,427 | +71 |
| Jefferson | -11,634 | -14,075 | -14,009 | +66 |
| Schuylkill | -18,637 | -27,781 | -27,732 | +49 |
| Potter | -5,450 | -6,300 | -6,261 | +39 |
| Huntingdon | -10,551 | -12,850 | -12,813 | +37 |
| McKean | -9,271 | -10,872 | -10,849 | +23 |
| Montour | -2,101 | -2,796 | -2,776 | +20 |
| Mifflin | -11,051 | -13,285 | -13,266 | +19 |
| Bedford | -16,465 | -19,320 | -19,308 | +12 |
| Columbia | -6,463 | -10,673 | -10,661 | +12 |
| Cameron | -852 | -1,172 | -1,180 | -8 |
| Warren | -7,063 | -8,838 | -8,861 | -23 |
| Crawford | -12,717 | -17,310 | -17,335 | -25 |
| Juniata | -6,271 | -7,459 | -7,488 | -29 |
| Tioga | -11,344 | -13,131 | -13,162 | -31 |
| Forest | -818 | -1,248 | -1,281 | -33 |
| Wayne | -10,076 | -12,934 | -12,992 | -58 |
| Sullivan | -1,302 | -1,742 | -1,807 | -65 |
| Venango | -9,540 | -12,055 | -12,121 | -66 |
| Westmoreland | -16,318 | -43,766 | -43,838 | -72 |
| Fulton | -4,788 | -5,938 | -6,015 | -77 |
| Lawrence | -2,376 | -10,337 | -10,417 | -80 |
| Carbon | -3,991 | -9,737 | -9,819 | -82 |
| Mercer | -6,413 | -15,084 | -15,183 | -99 |
| Elk | -3,019 | -6,234 | -6,356 | -122 |
| Bradford | -14,779 | -17,698 | -17,846 | -148 |
| Somerset | -16,870 | -22,162 | -22,310 | -148 |
| Indiana | -9,209 | -14,757 | -14,916 | -159 |
| Pike | -5,496 | -9,310 | -9,478 | -168 |
| Armstrong | -12,320 | -16,882 | -17,066 | -184 |
| Beaver | 7,067 | -5,860 | -6,071 | -211 |
| Clearfield | -13,030 | -19,168 | -19,423 | -255 |
| Cambria | -2,563 | -16,806 | -17,122 | -316 |
| Washington | -1,175 | -19,657 | -20,019 | -362 |
| Greene | -286 | -4,427 | -4,884 | -457 |
| Fayette | 5,347 | -11,283 | -11,861 | -578 |
Source: Pennsylvania Department of State, Voter Registration Statistics, certified county counts for each November election 2009 to 2026 (https://www.pa.gov/agencies/dos/resources/voting-and-elections-resources/voting-and-election-statistics), and the current voter registration workbook, sheet Party-to-Party(2026) (https://www.pa.gov/content/dam/copapwp-pagov/en/dos/resources/voting-and-elections/voting-and-election-statistics/currentvotestats.xlsx). All retrieved November 6, 2026. Each year's county rows were checked against the statewide total the department prints. Liberty Tribune analysis.
Free to cite or republish with attribution and a link. The chart is ours and may be reused on the same terms.
Republish this story, free
Newsrooms and newsletters may run this story and its chart at no cost. The credit line and the link back are already written in. Edit for length, keep the facts. Full terms.